Operations
Trips, drivers and site work sheets, from which timesheets and payroll are calculated.
Context
Haulage · constructionThe haulage and construction company kept its trips in one record and its employee timesheets in another. The real profit per truck or per kilometre could only be worked out by comparing the two by hand, at the end of the month — that is, after the month was over and there was nothing left to correct. They needed one place where the trip, the kilometres and the hours worked add up to the figure on their own, as it happens.
Architecture
The trip, the kilometres and the hours worked add up to the figure inside one system.
Profit per truck no longer needs two records compared by hand at the end of the month — that is, after the month is over and there is nothing left to correct.
The profit-per-kilometre threshold is an alert, not a report.
A truck below the threshold shows up on the day it drops, so the next trip can be corrected.
The same database serves the haulage side and the site work, each with its own modules and rates.
The company has several activities but one financial truth. Separate modules would have meant, once again, two records to compare.
What I built
Financial dashboard for the fleet
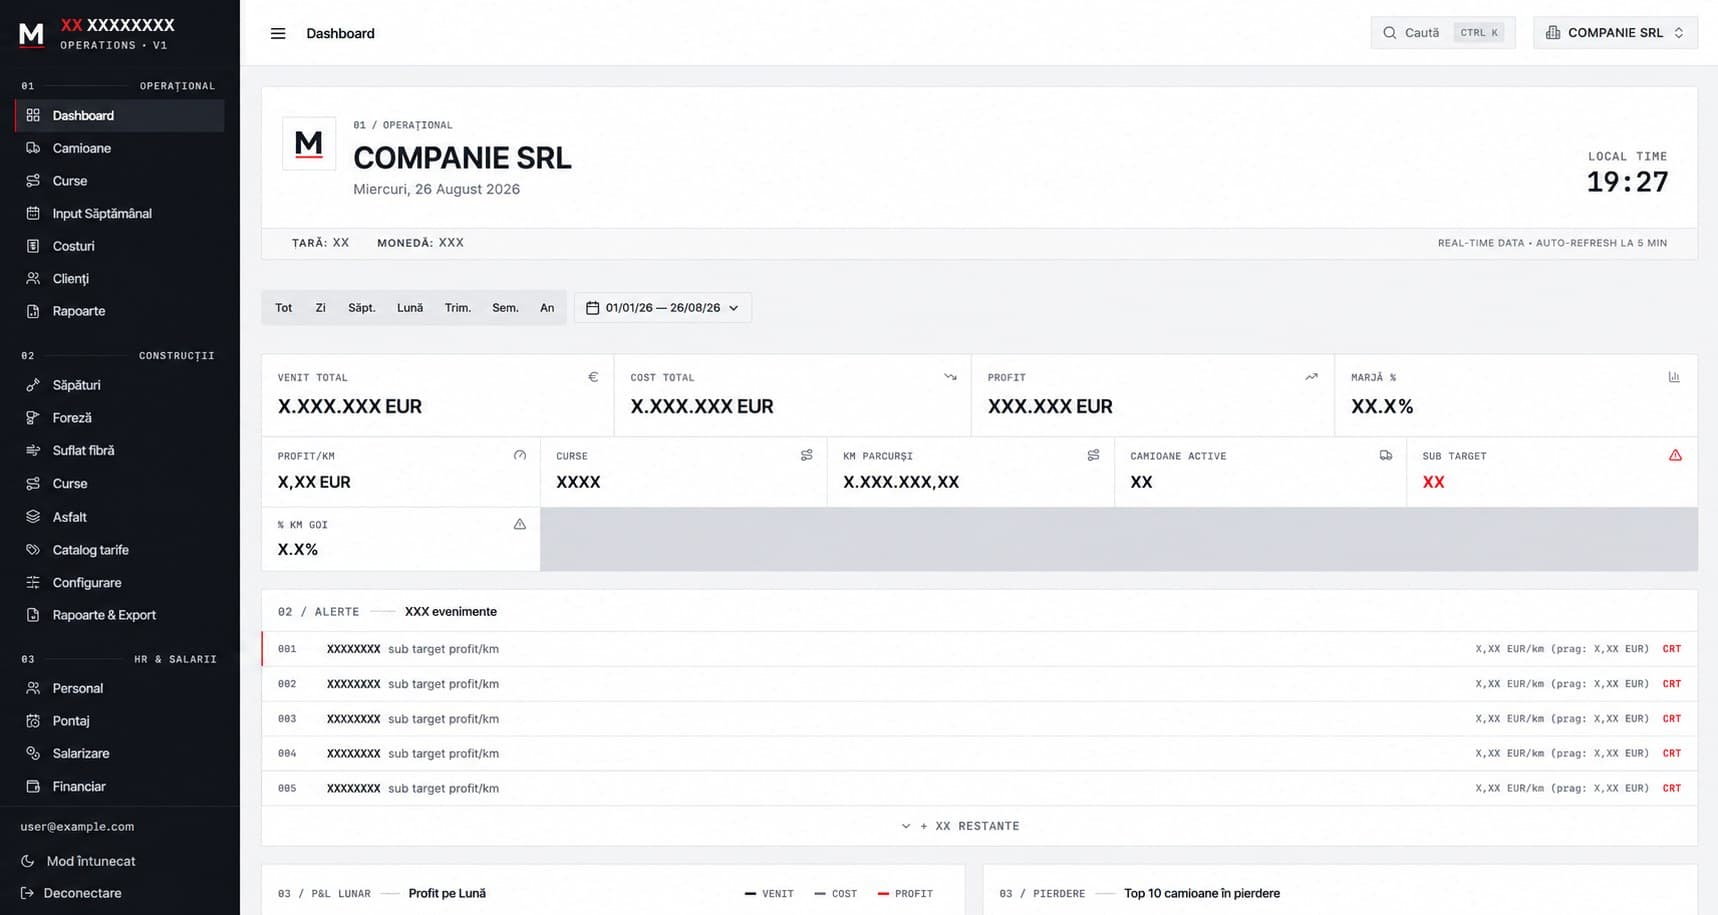
The dashboard works out revenue, cost and profit from the trips, with profit per kilometre and an alert when a truck drops below the threshold set for it.
Trips and kilometres
Every trip is tied to a truck and feeds the total kilometres driven and the share of empty kilometres, both visible on the same dashboard.
Monthly timesheets
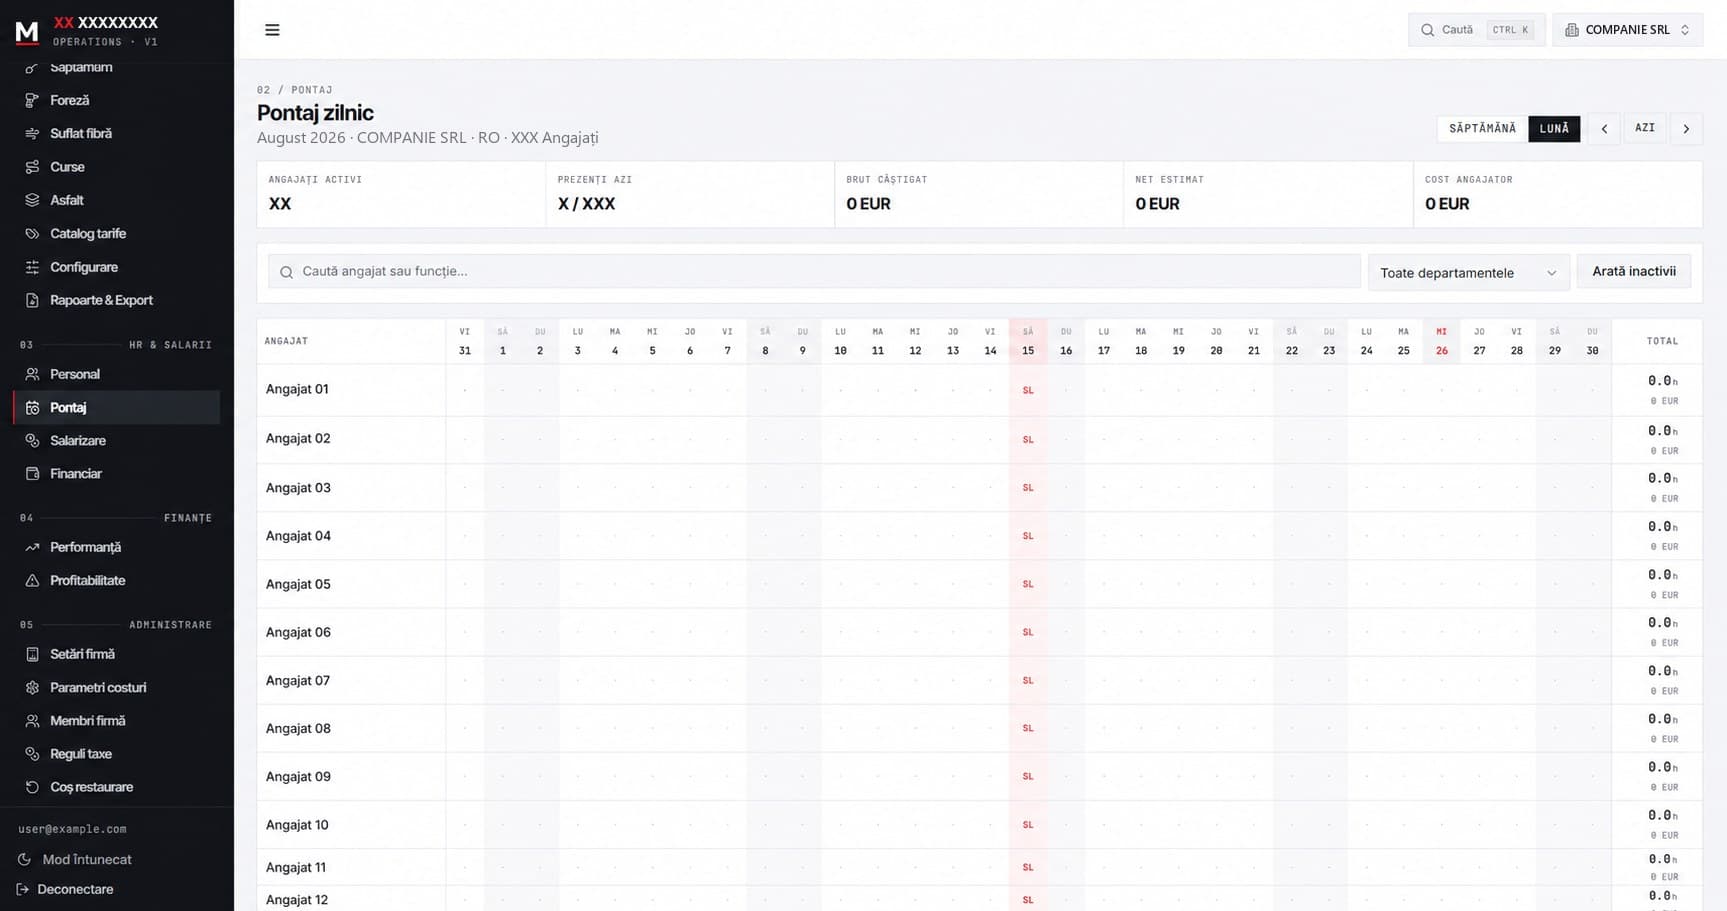
Timesheets are kept by month, one employee per row and the days of the month as columns, with total hours and employer cost calculated automatically.
Modules for the site
For construction work, the same trips are joined by dedicated modules — excavation, drilling, asphalt — each with its own rate card.
How it looks
Stack
Result
- The timesheet record kept outside the record of trips.
- Comparing the two by hand at the end of the month.
- Waiting for the end of the month to find out the profit per truck.
- Revenue, cost and profit across trips are read on the same dashboard as the kilometres and the active trucks.
- The monthly timesheet works out total hours and employer cost on its own.
- GPS tracking shows where a truck is at the moment the question is asked.
Reper
Want something similar?
Describe your workflow and I tell you what would change compared with the project above — and how long it would take.